COOPERATION MODEL
ARTIFICIAL INTELLIGENCE
PRODUCT ENGINEERING
DevOps & Cloud
LOW-CODE/NO-CODE DEVELOPMENT
INDUSTRY
FRONTEND DEVELOPMENT
CLOUD DEVELOPMENT
MOBILE APP DEVELOPMENT
LOW CODE/ NO CODE DEVELOPMENT
EMERGING TECHNOLOGIES


Writing code correctly is important, but it’s equally crucial to understand how it performs in a real environment. To get a better sense of what happens internally, Java profiling tools can significantly streamline this process. While you may need to dedicate some extra time to profiling, it will ultimately save you a great deal of time that would otherwise be spent debugging without the help of these tools.
Java profilers provide valuable insights into CPU usage, memory allocation, thread execution, and much more. Different tools offer various types of insights, which we’ll explore in this article.
A Java profiler is a tool that helps you monitor the performance of your Java program. It tracks when objects are created, when methods are called, how many times loops run (including recursive calls), how threads are executing, and when memory is cleaned up. By analyzing how your Java code behaves within the system it's running on, profilers help identify performance issues and areas that could be optimized.
Profiling is an essential optimization step. This helps you in getting valuable insights into the behavior of your code as well as various performance metrics. When you understand your application, you can better pinpoint its areas for fine-tuning and thus improve its efficiency.
At its core, profiling reveals a problem that may influence the performance. For example, profiling assists in identifying slow running methods or excessive memory usage, and so on. So, these tools can highlight the bottlenecks and lead towards finding ways to optimize their performances.
Profiling often plays a key role in improving both application performance and overall system health. When speed is the issue, not only do profilers improve performance but also accelerate the development process by identifying and addressing inefficiencies early.
There are several types of profilers. You probably are asking why there are such various kinds of profilers since the standard JVM profilers exist. The answer is easy: one tool is too weak. In the high-tech world, there's no golden hammer.
For instance, you may be required to concentrate on a specific area, say CPU usage or detecting memory leaks. Conversely, if you are looking for a general overview of how your application is performing, then you require a mix of tools that give you the right insight.
So, which profiler fits your bill? This article will help you navigate and make your choice.
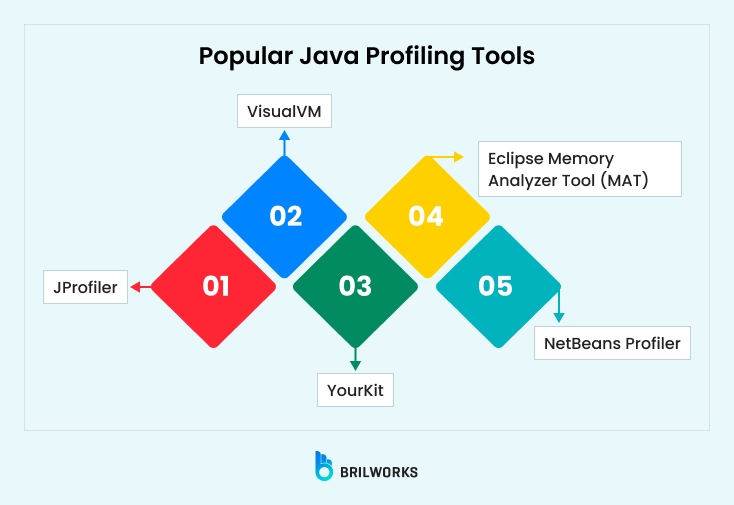
Below, we’ve listed some of the most popular Java profilers that can streamline the profiling process and are widely used by Java developers.

These are tools that come with the Java Development Kit (JDK) and are used to monitor and improve the performance of Java programs. You don’t need to install anything extra to use them. Here’s a simple explanation of each tool:
jstat: This tool helps you monitor how Java is using memory and handling things like garbage collection (the process of cleaning up unused memory). You can use it through the command line to check things like memory usage for your Java program.
jmap: jmap shows detailed information about the memory used by a Java program, such as how much space objects are taking up. It helps you understand memory usage better and can even create a snapshot (dump) of the memory to analyze later.
jcmd: This tool sends commands to the Java Virtual Machine (JVM), such as asking it to generate a memory dump. It’s useful for diagnosing problems with how the Java program is running.
jhat: jhat helps you explore the memory snapshot (heap dump) created by tools like jcmd. It helps you look at the objects in memory and find issues like memory leaks, where objects are stuck in memory even though they’re no longer needed.
hprof: hprof records detailed information about how your Java program is using memory and CPU. It helps track performance issues like slow memory usage or excessive CPU consumption. You can use it to gather data on how much memory different parts of your program are using or to find performance bottlenecks.
It is lightweight and can be used during development and production. It automatically detects and lists Java apps running on your computer or remote systems (as long as the jstatd service is running on the remote machine). If an app isn’t automatically detected, you can add it manually using a JMX (Java Management Extensions) connection.
It provides detailed information about each Java process, including the process ID (PID), main class, JVM version, JDK path, JVM flags, and system properties. VisualVM also tracks performance metrics like CPU and memory usage, garbage collection, and the number of threads running.
For deeper analysis, you can take thread dumps to see what’s happening inside your app or create heap dumps to identify memory leaks. If an app crashes, VisualVM helps analyze core dumps to diagnose issues related to threads and memory.
Additionally, VisualVM allows you to save this data—thread dumps, heap dumps, and performance information—into a single file for offline analysis.
In short, VisualVM is a powerful tool that helps you monitor, debug, and optimize your Java applications effectively.
Java Mission Control (JMC) and Java Flight Recorder (JFR) are sophisticated profiling tools designed for high-performance Java application monitoring. They are especially valuable in a production environment where low overhead is crucial, as JMC provides very detailed insights into application behavior with minimal performance impact.
JFR captures very detailed runtime events that would help to produce information necessary for performance tuning. This is how application performance can be deepened by revealing bottlenecks and potential optimization points. Being an event-driven mechanism for data collection, JFR does not require much system resource. Therefore, it can continuously monitor in live systems.
Main advantages of using JMC and JFR include the following:
By using JMC with JFR, developers can analyze comprehensive system behavior and performance of the threads efficiently. This potent combination is indispensable for broad performance diagnostics and real-time monitoring. It can hugely enhance the understanding and optimize the Java application.
YourKit Java Profiler monitors and improves your app performance by showing you what's going on with its threads-those parts of your application that run in parallel. If a thread gets stuck, the profiler quickly alerts you and shows you which threads are blocked and why.
It also lets you see how things like web requests (HTTP) and database queries (SQL) are being handled by your app, so you can get a full picture of performance.
The profiler makes it easy to track how your app is using CPU, memory, and handling things like garbage collection (cleaning up unused memory). If your app is throwing a lot of exceptions (errors), it will quickly show you where they're happening.
YourKit also supports obfuscated apps, hidden or renamed for protection, by tools such as ProGuard or Allatori. You should be able to obfuscate your mod file and it will display the original names of things in your code.
It also collects performance data, so you can control how much data it collects, which will not slow down your app too much. It is so efficient that you can use it in production. It even lets you export the data in various formats so you can share or analyze later, and you can automate it for continuous monitoring.
Furthermore, it also has a flexible API, which means developers can create custom features and command line tools to do profiling tasks without the UI. There are different licensing options, including free licenses for open-source projects and discounts for schools and research groups.
JProfiler is a full-fledged tool that easily identifies and resolves performance issues. This tool is highly acclaimed due to its comprehensive analysis, intuitive interface, and detailed reports on CPU, memory, and thread performance.
It is very good at detecting memory leaks, which are critical to maintaining application health. Its heap walker and thread dump analyzer provide deep insights into the behavior of applications under load. These features are critical to optimizing resource utilization in Java applications.
JProfiler is flexible enough to be used in different environments because of its integration capabilities. It supports remote profiling, especially in distributed applications. Its remote profiling ensures that developers monitor applications regardless of the setup for deployment.
Eclipse Memory Analyzer Tool (MAT) is a powerful Java profiling tool especially designed for heap analysis. It's an open-source solution that efficiently handles memory leaks and consumption issues. MAT analyzes heap dumps of memory consumption, helping developers optimize the memory usage within their application.
The strength of MAT lies in the ability to analyze a large heap dump in very little time. Equipped with advanced algorithms that give in-depth insight into an application's memory dynamics, it gives valuable insights on how objects and classes fill memory. It is helpful in the analysis for performance tuning.
Besides, MAT provides concise, actionable reports that summarize findings clearly. These reports guide developers on problematic code sections that lead to excessive memory usage. This process really helps improve the overall performance and stability of Java applications.
The NetBeans Profiler offers seamless integration for Java application profiling within the NetBeans IDE. It surpasses all other profiling tools in its ability to offer a real-time profiling facility: developers can monitor applications immediately as they develop. Such an interface makes NetBeans Profiler suitable for newcomers and professionals alike.
One of the unique features about NetBeans Profiler is how it graphically represents usage of CPU, memory, and threads. Visualization, therefore, can be employed to identify easily the potential bottlenecks in applications and optimize resource usage. Application workflows can be set without interrupting specific profiling tasks.
The NetBeans Profiler excels at dynamic code analysis and provides accurate method execution and memory allocation insights. This allows developers to quickly detect bugs and improve their code. Developers are able to deliver high-performance applications with better code quality and efficiency with such insights.
So you have found your right Java profiling tool. If you select the right profiler, you will be able achieve effective performance optimization. Each project has different requirements, therefore the choice should be relevant. These factors include the type of application, the type of performance goals, and resource constraints.
When selecting a profiling tool, ensure it meets the following criteria to fit your needs:
Compatibility: Ensure that the tool supports your version of Java and integrates well with your development environment.
Features: Look for features such as CPU, memory, and thread profiling, along with real-time monitoring.
Ease of use: Ensure the user interface and learning curve fit well with your team's experience.
Overhead: Look for tools that will incur minimal overhead in performance while profiling, especially in a production environment.
Additionally, evaluate the quality of the tool's community support and documentation. A strong user community can provide valuable resources for troubleshooting and knowledge exchange. Investing time in selecting the right tool can greatly enhance your application's performance and development efficiency. Remember, a well-chosen profiler not only diagnoses issues but also equips your team with insights for continuous improvement.
Profiling tools in Java are helpful for maintaining high application performance and stability. They provide insightful visibility into the behavior of the application and its resource usage, allowing developers to quickly find bottlenecks and memory issues.
Integrating these tools into the lifecycle of development would help teams gain better performance, scalability, and reliability.
These profilers are becoming the more powerful and indispensable by the pace of the changing technology. Profiling tools would help developers or managers optimize application performance that can ensure a smoother customer experience. The adoption of these tools would be essential in encouraging innovation and sustaining competitive position in software development.
If you enjoyed this, be sure to check out one of our other Java articles:
Get In Touch
Contact us for your software development requirements
Get In Touch
Contact us for your software development requirements